
Chapter 6 · architecture paths
Deployment and monitoring integration choices
Shared collector and evidence concepts support a standalone scrape path and a centralized MainsKeeper platform. They solve different jobs.
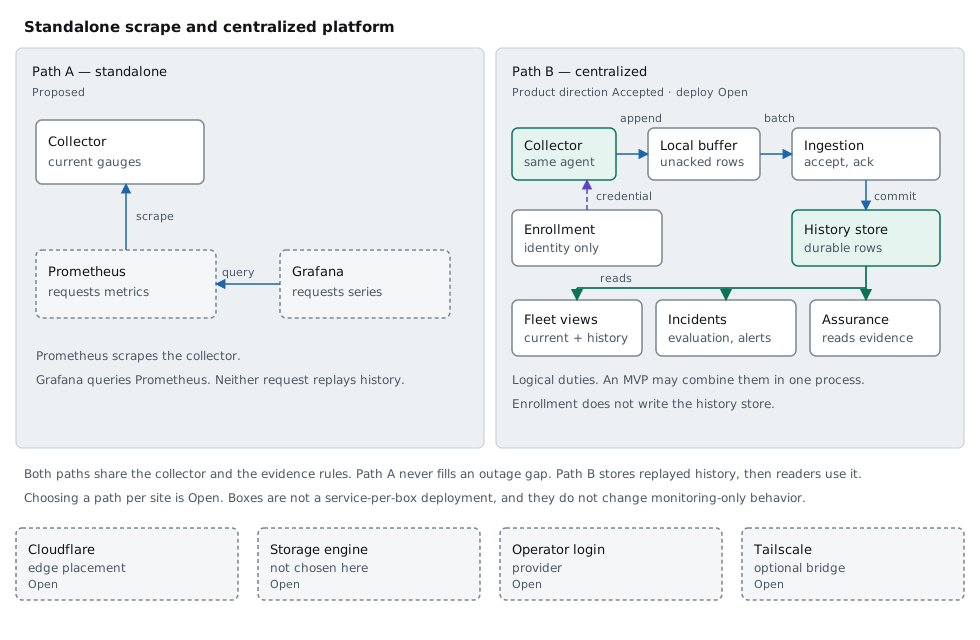
Figure 14. Standalone monitoring vs centralized MainsKeeper platform
Takeaway: Prometheus scrapes the collector, and Grafana queries Prometheus. Telemetry is collector, then buffer, then ingestion, then history. Enrollment only establishes identity. Fleet views, alerts, and Assurance read stored state. The open boxes are not chosen by the drawing.
Related: Decision register
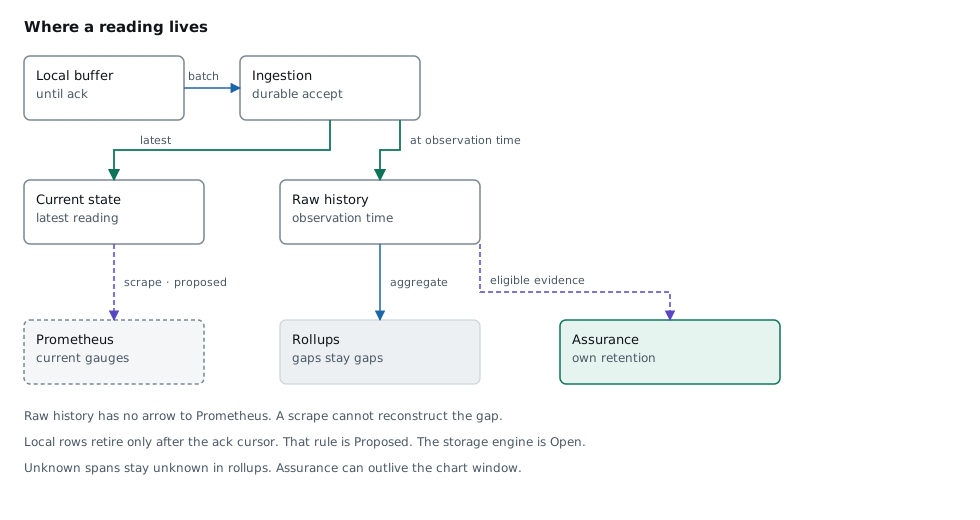
Figure 13. Current state · raw history · aggregates · durable evidence
Takeaway: Ingestion writes current state and raw history. Rollups and Assurance read that store. Prometheus is connected only to current gauges.
Related: Buffering figure
Path A — Standalone collection
Proposed Operate the collector primarily as a metrics source for an existing Prometheus / Grafana stack. Still keep a local buffer if you care about WAN gaps. A rollup in Grafana does not recreate a dropped span. You do not automatically get fleet enrollment UX, Battery Assurance findings, or cross-site incident timelines.
Path B — Centralized platform
Accepted as product direction in the design handoff: dashboard enrollment, site-first fleet views, history, alerts, Assurance. Open backend runtime, storage engine, production retention, and exact API transport.
Explicit Open implementation decisions
- Cloudflare (and any edge placement) — not settled by diagrams.
- Storage selection — engine and retention tiers undecided. Alternatives and a recommendation are in the decision register.
- Authentication providers — UI design explores Cloudflare Access with GitHub (Proposed); not a locked production choice. Operator, collector, and UPS-secret boundaries are compared in the register.
- Tailscale / network bridge — optional connectivity aid; Open.